blog
7 Proven Steps to Implement a Data-Driven Marketing Strategy in India [2025 Playbook]
![7 Proven Steps to Implement a Data-Driven Marketing Strategy in India [2025 Playbook]](https://www.tangence.in/blog/wp-content/uploads/2025/07/7-Proven-Steps-to-Implement-a-Data-Driven-Marketing-Strategy-in-India.webp)
In 2025, data is no longer just a marketing asset it’s the fuel that powers business growth.
With India’s digital economy booming, brands are collecting more data than ever before through websites, apps, UPI transactions, marketplaces, and even WhatsApp conversations.
But here’s the challenge: most businesses struggle to turn this raw data into actionable insights that drive ROI.
Data-driven marketing bridges that gap.
Instead of guessing which campaigns work or relying on outdated “spray and pray” tactics, you can use data to understand customer behavior, personalize messaging, and allocate budgets to the channels that truly perform.
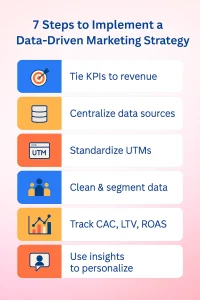
In this guide, I’ll show you 7 proven steps to build and implement a data-driven marketing strategy in India for 2025.
These are the same steps leading brands use to cut costs, improve targeting, and boost ROI without drowning in spreadsheets.
Ready to stop guessing and start growing?
Let’s dive into the actionable playbook that will help you harness the power of data and stay ahead in India’s fast-evolving digital landscape.
Step 1 – Clarify Growth Goals & Translate Them into Measurable KPIs
Before you pull a single report, get crystal clear on what business outcome you’re trying to drive.
Data without a goal is noise; data mapped to revenue becomes a roadmap.
3 Things to Do First
- Choose 2–3 growth goals for the next quarter or two (leads, revenue, repeat orders, CAC reduction, etc.).
- Assign one primary KPI per goal (the number you’ll defend in meetings).
- Add 2–3 supporting metrics + data sources + reporting cadence so the team knows where numbers come from and how often to review.
India-Specific Angle
Because channel behavior and costs vary widely across regions, include Geo (state/tier city), language preference, and payment behavior (UPI vs COD) where relevant. These segments often surface profitable micro‑audiences.
KPI Mapping Mini Table
| Business Goal (Q1–Q2 FY2025) | Primary KPI | Supporting Metrics | Data Source(s) | Reporting Cadence |
| Increase qualified B2B leads from manufacturing sector by 40%. | MQLs (Manufacturing) | Cost/MQL, Lead→SQL %, Avg Deal Size | LinkedIn Ads, Website Forms, CRM (Zoho/HubSpot) | Weekly |
| Grow repeat purchase revenue for D2C skincare brand in Tier‑1 cities. | Repeat Order Rate | AOV Repeat, UPI vs COD %, Email/SMS Conversion | Shopify, Razorpay, Email/SMS Platform | Bi‑Weekly |
| Reduce paid CAC by 20% in Tier‑2/Tier‑3 regions. | CAC (Target Regions) | CTR, CPL, Conversion Rate to Sale | Meta Ads, Google Ads, GA4, CRM | Weekly |
Pro Tip: If a metric doesn’t change spend, creative, or targeting decisions, drop it. Focus on the numbers that move money
Step 2 – Audit & Consolidate Your Marketing Data Sources
You can’t build a data-driven marketing strategy in India if your data is scattered across 10 different platforms and this is exactly where most Indian businesses struggle.
A proper data audit ensures you know what data you have, where it lives, and how reliable it is.
Why This Step Matters
- Without consolidation, you risk duplicate leads, inconsistent metrics, and misattributed revenue.
- By mapping all data sources, you create a single source of truth for your marketing team.
- It sets the foundation for advanced analytics, automation, and personalization.
Common Data Sources in Indian Marketing Stacks
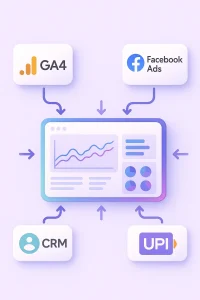
- Website & App: Google Analytics 4 (GA4), server logs.
- Advertising: Google Ads, Meta Ads, LinkedIn Ads, Amazon Ads.
- Marketplaces: Amazon.in, Flipkart, Meesho dashboards.
- CRM/Lead Management: Zoho CRM, HubSpot, LeadSquared.
- Email & SMS Platforms: WebEngage, MoEngage, Netcore Cloud.
- Payments & Transactions: Razorpay, PhonePe, UPI transaction data.
- Messaging: WhatsApp Business API, SMS providers.
- Offline Sources: Call centers, trade fairs, retail POS data.
How to Run a Quick Data Audit
- List all active marketing tools and platforms in a spreadsheet.
- Add columns for Owner, Access Level, Data Export Method, and Frequency (e.g., daily, weekly, monthly).
- Identify gaps or silos (e.g., Facebook Ads not linked to GA4).
- Remove inactive or duplicate sources to simplify reporting.
Mini Data Audit Template
| Source | Data Owner | Access Method | Export Frequency | Notes / Gaps |
| GA4 | Marketing Team | Web Dashboard | Real-time | Linked with Ads |
| Meta Ads | Paid Media | API / CSV | Daily | Missing UTM tags |
| Razorpay | Finance Team | Dashboard / API | Weekly | Add refund data |
| WhatsApp API | Support Team | CSV Export | Daily | No CRM sync |
Pro Tip: If you don’t have the budget for a data warehouse, even consolidating data into Google Sheets + Looker Studio can give you powerful insights.
Step 3 – Tracking & Tagging Framework for Your Data-Driven Marketing Strategy in India
A tracking framework is the backbone of data-driven marketing.
Without proper UTM tagging or event tracking, you’ll never know which campaign is driving real revenue.
This step ensures 100% traceability of your marketing efforts.
Why You Need a Tracking Framework
- Avoid data loss: Without consistent tags, analytics tools misattribute traffic (e.g., “Direct” traffic in GA4).
- Cross-channel clarity: See which ads, emails, or WhatsApp campaigns convert best.
- Offline sync: Combine online + offline touchpoints (e.g., leads from trade shows or phone calls) for a complete funnel view.
Actionable Steps to Build Your Framework
- Standardize UTM Parameters: Use a consistent naming convention across all campaigns to track sources, mediums, and campaigns correctly.
- Key UTM Tags:
- utm_source: Platform name (facebook, google, linkedin).
- utm_medium: Type of campaign (cpc, email, social).
- utm_campaign: Promotion name (diwali_offer_2025).
- utm_content: Ad variation or creative (carousel_ad, text_link).
- Track Events in GA4 & CRMSet up custom events to track high-value actions:
- Examples: form_submit, add_to_cart, app_install, upi_payment_success.
- Use Google Tag Manager (GTM) to fire events without coding.
- Sync these events with your CRM for lead-to-revenue tracking.
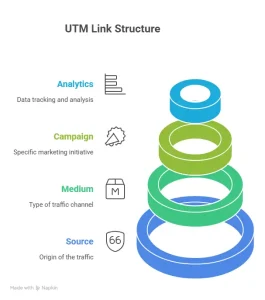
Image Source: Created using Napkin AI
- Offline Conversion UploadsIf you’re generating leads from call centers, trade shows, or walk-ins, export these leads (CSV format), hash the data (email/phone), and upload them to platforms like Meta Ads or Google Ads for offline conversion tracking.
Step 4 – Clean, Segment & Enrich Customer Data
Collecting customer data is easy.
Making that data usable is the real challenge.
If your leads are filled with duplicates, incomplete fields, or mismatched formats (e.g., +91-98765-43210 vs 9876543210), your campaigns will fail to deliver accurate insights or personalization.
A clean and segmented dataset helps you target the right audience, reduce wasted ad spend, and increase ROI.
Step 4.1: Data Cleaning Essentials
Why clean data? Dirty data leads to incorrect reporting and wrong decisions.
Key Actions:
- Deduplicate entries – Remove repeated leads from CRM (common in India due to multiple touchpoints like WhatsApp + web forms).
- Normalize phone numbers – Convert all to +91 format for easy WhatsApp integration.
- Standardize location data – Use consistent spellings (B’luru vs Bangalore vs Bengaluru).
- Fix missing fields – Add placeholders for city, language, source when blank.
Tools to Use:
- Google Sheets =UNIQUE() for deduplication.
- CRM features like Zoho’s data cleanse tool.
- Excel’s Find & Replace for format consistency.
Step 4.2: Smart Segmentation Strategies
Segmentation allows you to target campaigns with precision.
Examples of Segments (India Focus):
- By Region: Tier-1 vs Tier-2/Tier-3 cities (e.g., Delhi, Mumbai vs Lucknow, Patna).
- By Language: Hindi, Tamil, Telugu, Bengali campaigns.
- By Payment Behavior: UPI users vs COD customers.
- By Purchase Frequency: First-time buyers vs repeat customers.
- By Platform: Website form leads vs WhatsApp chats vs marketplace buyers.
Step 4.3: Data Enrichment
Enhance existing data by adding value-rich attributes:
- Purchase history & AOV (Average Order Value).
- Engagement metrics (email open rate, click-through).
- Demographics: Age group, city, and interests.
- Behavioral tags: (e.g., Abandoned Cart User, Price-Sensitive Buyer).
Pro Tip:
Set up automated cleaning rules via Zapier, Make, or CRM workflows to keep your data clean and segmented in real time.
Step 5 – Analyze Campaign Performance & Surface Actionable Insights
To maximize the success of your data-driven marketing strategy in India, analyzing campaign performance is non-negotiable.
Once your data is clean and organized, the next step is to convert numbers into stories and actions. This means analyzing which campaigns are working, which aren’t, and why.
In India’s highly competitive market, this analysis helps you reallocate budget, improve targeting, and boost ROI.
Key Metrics to Track
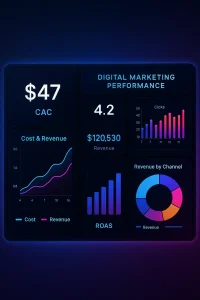
To get the full picture, evaluate performance across multiple dimensions:
- Acquisition Metrics:
- Cost Per Lead (CPL): Ideal for B2B or lead-gen campaigns.
- Customer Acquisition Cost (CAC): Total spend ÷ number of paying customers.
- Click-Through Rate (CTR): Performance of ad creatives.
- Revenue Metrics:
- Return on Ad Spend (ROAS): Revenue generated per ₹ spent.
- Average Order Value (AOV): Average revenue per transaction.
- Lifetime Value (LTV): Predicted revenue from a customer over time.
- Engagement Metrics:
- Funnel Drop-off Rates: Identify bottlenecks (e.g., cart → UPI payment).
- Channel-Specific Performance: Meta Ads vs Google Ads vs marketplaces.
Steps for Effective Analysis
- Create Performance Dashboards:
Use Google Looker Studio or Power BI to visualize data across GA4, CRM, and ad platforms. - Identify Top Performers:
- Which ad creatives have the highest CTR?
- Which regions/languages deliver the best ROAS?
- Spot Weak Points:
- High impressions but low CTR? Creative fatigue or wrong audience.
- High leads but low conversions? Lead quality or follow-up gap.
- Cross-Analyze Data:
Combine payment data (UPI vs COD) with ad data to optimize for high-value users.
Campaign Analysis Template
| Channel | Spend (₹) | Leads | Cost/Lead (₹) | Conversion Rate (%) | Revenue (₹) | ROAS |
| Google Ads | 50,000 | 220 | 227 | 12% | 2,50,000 | 5.0 |
| Meta Ads | 40,000 | 190 | 210 | 10% | 1,80,000 | 4.5 |
Pro Tip: Review metrics weekly for tactical adjustments (ads, creatives) and monthly for strategic decisions (budget reallocations, new channels).
Step 6 – Activate Insights: Personalization, Budget Reallocation, Automation
Collecting and analyzing data is only half the battle.
The real growth happens when you act on insights by personalizing customer experiences, reallocating budgets to high-performing channels, and automating workflows for consistent results.
Step 6.1: Personalization for the Indian Market
India’s market is highly diverse different languages, cultures, and buying behaviors across regions.
Personalized campaigns outperform generic ones because they speak directly to customer needs.
Actionable Personalization Ideas:
- Language-based campaigns: Create Hindi, Tamil, or Bengali ad creatives for local targeting.
- Location-specific offers: Use geo-segmentation (e.g., “Get free shipping in Mumbai this week”).
- Behavioral triggers:
- Send WhatsApp reminders for abandoned carts within 2 hours.
- Offer discounts to customers who have COD as default payment to shift them toward UPI/online payments.
- Dynamic content on websites: Use tools like VWO or WebEngage to show different banners based on city, device, or previous purchases.
Step 6.2: Budget Reallocation
Your data analysis shows which channels bring the highest ROI.
Now, shift budgets dynamically:
- Increase ad spend for high-ROAS states/cities while pausing poorly performing locations.
- Reallocate from low-performing creatives to top-clicked ad formats (carousel vs video).
- Shift 10–20% of ad spend to retargeting campaigns (email + WhatsApp) as they deliver cheaper conversions.
Step 6.3: Automation for Consistent Growth
Manual marketing is slow and error-prone. Use automation to save time and scale faster:
- Email/SMS automation: Send personalized welcome offers or product recommendations.
- WhatsApp API sequences: Automate order confirmation, shipping updates, and follow-ups.
- Lead scoring: Automate high-quality lead prioritization in CRMs like Zoho or HubSpot.
- Ad campaign rules: Set auto-pause rules for underperforming ads (e.g., CTR < 0.5% for 48 hours).
Recommended Tools:
- WebEngage, MoEngage, Clevertap for personalization and push notifications.
- Zapier or Make for CRM and marketing tool integrations.
- Looker Studio or Power BI for automated reporting dashboards.
Pro Tip:
Start with 1-2 automation workflows (e.g., abandoned cart email + WhatsApp reminder). Measure results, then gradually build a full automation stack.
Step 7 – Measure, Optimize & Scale (Dashboards + Predictive Models)
The final step is where you turn your marketing process into a repeatable growth engine.
By continuously measuring performance, optimizing campaigns, and using predictive models, you can scale your efforts without guesswork.
A scalable data-driven marketing strategy in India relies on accurate dashboards and predictive analytics for continuous optimization.
Step 7.1: Build Executive & Operational Dashboards
Dashboards consolidate all your KPIs into a single view, helping you make data-backed decisions in real time.
Types of Dashboards:
- Executive Dashboard (Monthly/Quarterly):
Focus on revenue, CAC, ROAS, and LTV across channels. Ideal for leadership teams. - Operational Dashboard (Weekly/Daily):
Track granular metrics like CTR, CPL, funnel drop-offs, and ad performance.
Tools to Use:
- Google Looker Studio (free and powerful).
- Power BI or Tableau for more advanced visualization.
- Supermetrics + Google Sheets for flexible reporting.
Example Dashboard Metrics:
- Traffic by channel (Google Ads vs Meta Ads).
- Revenue by payment method (UPI vs COD).
- State-wise campaign performance (Delhi vs Bangalore vs Tier-2 cities).
- Funnel visualization (Leads → SQL → Sales).
Step 7.2: Optimization Loop
-
Weekly:
- Pause underperforming ads (low CTR or high CPL).
- A/B test creatives, ad copies, or landing page headlines.
- Adjust budgets to high-performing states/cities or platforms.
-
Monthly:
- Analyze LTV vs CAC to refine targeting.
- Review campaign attribution identify what’s driving final conversions.
Step 7.3: Leverage Predictive Analytics
Predictive models help you anticipate customer behavior and allocate resources more effectively:
- Churn Prediction: Identify customers likely to drop off and re-engage with targeted offers.
- High-LTV Segments: Use past purchase data to target similar high-value audiences.
- Predictive Budgeting: Estimate which campaigns will deliver the highest ROI based on historical data.
Step 7.4: Growth Loop Visualization
Data → Insights → Action → Measure → Optimize → Scale
This loop ensures your data-driven marketing strategy evolves with trends and customer behavior.
Pro Tip: Set up automated email alerts (via GA4 or Looker Studio) for sudden spikes or drops in performance metrics so you can act instantly.
Data Isn’t the Advantage – Action Is
In 2025, simply collecting data isn’t enough.
The real winners in India’s digital marketing landscape are the brands that analyze, act, and adapt using data-backed strategies.
By following these 7 proven steps from defining clear KPIs to building dashboards and leveraging predictive models you’ll not only gain clarity on what’s working but also unlock consistent, scalable growth.
Want a customized data-driven marketing strategy in India for your business?
FAQs
1. What is a data-driven marketing strategy in India?
It is an approach where businesses use real-time data, customer insights, and performance metrics to plan and optimize campaigns. With the rise of UPI transactions, e-commerce platforms, and regional targeting, Indian businesses can personalize campaigns, improve ROI, and make data-backed decisions rather than relying on guesswork.
2. Why is a data-driven marketing strategy in India important in 2025?
In 2025, India’s digital ecosystem is booming with platforms like UPI, WhatsApp Business, and marketplaces like Flipkart and Amazon. It helps brands understand consumer behavior across regions, optimize ad spend, and stay ahead of competitors by leveraging predictive analytics and real-time performance insights.
3. What are the key steps to build a data-driven marketing strategy in India?
The 7 key steps to create a successful data-driven marketing strategy in India are:
-
Set clear growth goals and KPIs.
-
Audit and centralize all marketing data (ads, CRM, UPI).
-
Build a proper tracking and UTM framework.
-
Clean, segment, and enrich customer data.
-
Analyze campaign performance and surface insights.
-
Activate insights with personalization and automation.
-
Continuously optimize with dashboards and predictive models.
4. Which tools are best for a data-driven marketing strategy in India?
Some powerful tools to implement a data-driven marketing strategy are Google Analytics 4 (GA4), Looker Studio, HubSpot CRM, Zoho, WebEngage, MoEngage, and Razorpay dashboards. These tools provide deep insights into customer behavior, ad performance, and sales trends.
5. How can your digital marketing agency help with a data-driven marketing strategy in India?
Our agency specializes in designing and implementing a data-driven marketing strategy tailored to your industry. We audit your data sources, set up proper tracking frameworks, analyze KPIs like CAC, ROAS, and LTV, and create personalized campaigns that drive measurable ROI.